
The Franchise Tax Board (FTB) has released data on personal income taxes (PIT) levied and income reported by county on 2013 California tax returns. Many 2013 returns were not received until the extension filing deadline in October 2014, which means that now is the first opportunity to see preliminary data from all 2013 tax returns. Marin County once again had the highest median income reported on PIT returns. "Over the past 40 years," FTB noted, "the Bay Area counties of Marin, San Mateo, and Santa Clara have consistently reported the highest median incomes in the state." Statewide, the median income reported on tax returns also climbed in 2013, FTB said.
Vast Regional Differences in Personal Income Tax Base. The county-by-county FTB data shows that there are significant regional differences for the state government's dominant revenue source, the personal income tax, as shown below.
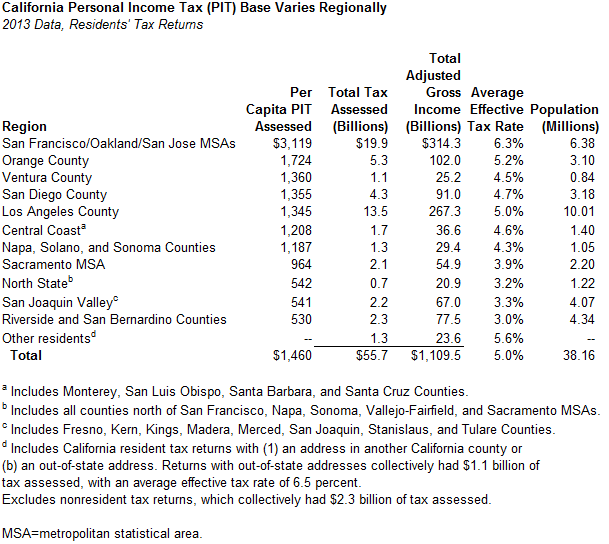
As measured by PIT levied per capita (per person), the Bay Area (specifically, the San Francisco/Oakland and San Jose MSAs) and Orange County are above the statewide average, while nearly every other part of the state is below. Outside of Orange County and those two Bay Area MSAs, only Napa County (grouped in the table above with two adjacent jurisdictions) has per capita PIT assessed ($1,856) at a level above the statewide average. (Using a different method, which considers nonresident tax returns, El Dorado County [$1,433] also is slightly above the statewide average.)
In California, higher-income tax filers pay higher tax rates, with additional tax rates on the highest-income filers currently levied as a result of Proposition 30 (2012). As a result, there are also big differences regionally in terms of the average effective tax rate paid on PIT returns. As shown above, the Bay Area and Orange County have average effective tax rates above the statewide average, while Los Angeles County's effective rate is essentially equal to the statewide average. (Napa County's average effective tax rate is 5.4%.)
The Inland Empire, the San Joaquin Valley, and the North State region have per capita PIT and average PIT tax rates that are well below the statewide averages. In general, this results from comparatively lower income levels in those regions.
Changes from 2012 to 2013 Among High-Income Filers. In an opinion column today, the Los Angeles Times' George Skelton reported that the top 1% of PIT filers accounted for 21.8% of California adjusted gross income and paid 45.4% of the state's PIT in 2013. This concentration of the PIT among high-income filers is somewhat less pronounced than in 2012, when changes in federal tax law and the Facebook IPO resulted in temporary boosts of income for many in that group. The same types of regional differences described above were present in the 2012 FTB county data.
(Updated at 5:50 pm on April 30, 2015, to add population totals to the table and other minor changes.)