
- All Articles Sales and Use Tax
Sales Tax Exemption for Manufacturing and R&D Equipment: An Update March 3, 2017
On March 1, 2017, BOE reported that taxpayers claimed an estimated $165 million of these tax exemptions in 2016—a 6% increase from 2015.
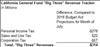
Administration's January 2017 Proposition 30/55 Revenue Estimates February 7, 2017
We display the administration's estimates for this revenue source as of January 2017.
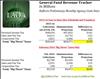
January 2017 State Tax Collections February 6, 2017
We have received preliminary data from tax agencies on January 2017 collections of California's major state taxes.
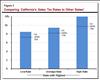
Sales Tax Rates: Prop. 30 and Comparisons to Other States December 15, 2016
California's sales tax rates are among the highest in the U.S., but different comparisons generate different rankings for California, ranging from second-highest to 11th-highest in the nation.
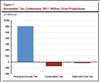
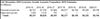
November 2016 State Tax Collections December 13, 2016
We discuss the preliminary data from tax agencies about November 2016 state tax collections.
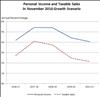
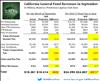
Fiscal Outlook: Proposition 30/55 Revenue Estimates November 16, 2016
We provide our updated Proposition 30/55 revenue estimates.
Fiscal Outlook: New LAO Sales Tax Model November 16, 2016
We discuss our office's new sales tax projection model.
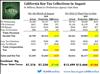
September 2016 State Revenues October 18, 2016
We have received preliminary information from tax agencies on September 2016 collections of the state's major taxes.
August 2016 State Revenues September 15, 2016
We have received preliminary collection data from the state's tax agencies for major revenue collections in August 2016.
July 2016 General Fund Revenues August 16, 2016
Tax agencies have provided preliminary information on key July 2016 state General Fund revenues.
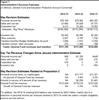
May Revision 2016: Proposition 30 Estimates May 23, 2016
We display the administration's Proposition 30 revenue estimates, as of the 2016 May Revision, as well as our office's estimates.
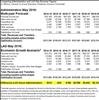
May Revision 2016: Administration & LAO Multiyear Revenue Figures May 17, 2016
This post compares the administration's multi-year forecast revenue estimates with those generated under the LAO May 2016 economic growth scenario through 2019-20. (This does not reflect required transfers to the Budget Stabilization Account under Proposition 2 under the LAO figures, as those estimates are still under development.)
May Revision 2016: Revenue Outlook May 16, 2016
This post discusses the near-term state General Fund revenue outlooks of both the administration and our office.
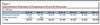
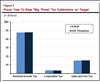
April 2016 "Big Three" Tax Collections May 9, 2016
We have now received preliminary data from all the tax agencies concerning April 2016 collections of the personal income tax, the sales and use tax, and the corporation tax. These are the state General Fund's "Big Three" revenue sources.
February 2016 State Revenues: Above Expectations...For Now March 10, 2016
We have received preliminary information from the state's tax agencies on February 2016 collections of the California's "Big Three" state General Fund taxes.